[This interview with me appeared in Jenny Rankin’s PSYCHOLOGY TODAY blog on January 19, 2019. Its title: “War Stories From the Accountability Battlefield.”]
Jenny Rankin (JR): What are some faulty conclusions you have seen educators draw from data in the California School Dashboard, the state’s accountability measurement system?
Steve Rees (SR): Let’s start with two examples of schools’ vital signs that are easy to represent: the condition of buildings and textbooks. In both cases, we can measure how old buildings and textbooks are, and describe the quality of both in a language that’s familiar to all. In fact, these two visible and tangible things have been part of the annual accountability reports in California for quite awhile. That’s an entirely good thing.
But some school vital signs are not tangible, and may be visible only to students – like the quality of the curriculum, and the instructional skill of the teachers who deliver it. These two factors are not only difficult to measure, but once they’ve been measured, they are hard to describe to citizens, parents and voters. But these two vital signs are at least the clear responsibility of those who govern and lead schools and districts. And they are not in California’s school accountability reports. In my view, that’s unfortunate.
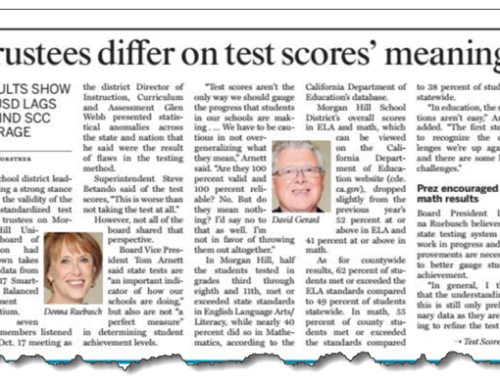
Then there’s this third category of vital sign that is tangible but only partially visible, like a graduation rate. It is revealed in these annual reports in only one dimension: quantity. The absence of attention to quality masks the meaning of the measure. This is a notoriously slippery event because the self-interest of students and systems is too well aligned. Both look good when a student graduates. But what does that student’s diploma mean? Other states award tiered diplomas, and the type of diploma a student earns reflects their coursework and their grades. Not so in California. More troubling is the all too common game of what’s called “credit recovery.” This describes a student who earns credit (often in the summer) for a course she has failed. This can be done honestly. But in some schools, the student “earns” credit by passing a dumbed-down version of the course, compressing a month’s work into a day’s effort. That makes it academic fraud, and it is all too common.
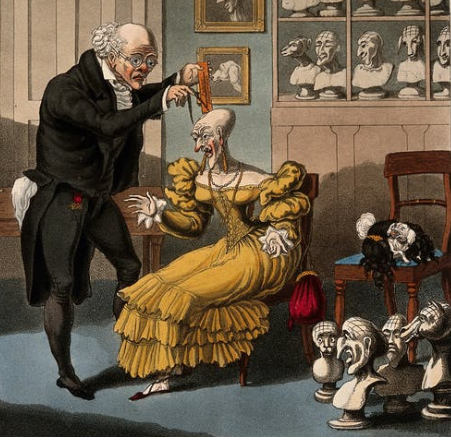
Phrenologists measured cranial capacity, and inferred intelligence from the size of cranial lobes. When bad science enlisted good measures in its service, the results were used by social Darwinists to affirm the inferiority of dark-skinned people and immigrants from southern Europe. The moral of this story: measurements serving a bad cause can do much harm.
The fourth category of vital signs is an estimate of how much students have learned in a year in three subjects: math, English and science. What goes on between the ears of kids in grades 3-8 and in grades 10 and 11 is neither tangible nor visible. What happens on these tests is the result, of course, of the quality and quantity of effort made by teachers and students, within schools whose structure and resources are determined by law, shaped by policy and funding. But if every party influences these outcomes, what do the scores and the year-to-year change really reflect? Who owns those results? If everyone owns them, nobody owns them. In my view, that makes them a weak vital sign. But there are other reasons I’ve come to hold this view.
Jenny Rankin (JR): Are some of these problems due to the data measurement tools themselves?
Steve Rees (SR): These tests – in California, students take a test very similar to the tests taken in a dozen other states in the Smarter Balanced Consortium – themselves have limits. I share Jim Popham’s assertion that it is not the tests themselves that cause problems. It is what Popham calls the “abysmal assessment literacy” of educators themselves that lead to misuses, misunderstandings and mistakes in human judgment. It is misunderstanding what the test results mean that is the core problem.
Take one dimension of assessment results: error margin. In California, there is no mention of the error margin in the reports that are mailed home to parents or delivered to classroom teachers. Only the districts lucky enough to have assessment directors on staff (about 1 out of every 8 districts) even see the size of the error margin of students, classrooms, schools and the district. This is a big deal. Here’s why. Each of these tests has between 35 and 45 questions. A student’s answers provide a reasonable estimate of his mastery of those standards that have appeared on the test. But the estimate enables you to say only this much about a student’s score: “Gabriela’s score on her 6th grade math tests was 2490. We’re pretty sure that if she took the test on a Tuesday instead of a Monday that she’d score within 27 points of that 2490 score.” Hiding that uncertainty and imprecision leads people to invest too much meaning in these scores. I also agree with Popham’s more fundamental criticism that the state assessments were never designed to capture estimates of instructional effectiveness. In maximizing the spread of students’ scores, these tests are unsuitable for comparing the instructional effectiveness of schools and districts.
But it gets worse. The results of these tests are used to gauge the size of achievement gaps between boys and girls, students getting and not getting lunch subsidies, and students of various ethnic groups. Three problems cloud a clearer understanding of the size and meaning of these gaps. First, the masking of imprecision and uncertainty makes the estimated sizing of the gap impossible for anyone but a statistician to understand. Second, the test itself was not designed to capture all the information about the highest and lowest scoring students. What psychometricians call the “spread” is necessarily limited. This means people are underestimating the size of gaps. Third, California Department of Education has baked a logic error into its accountability system. Their official dashboard compares each ethnic group to the status of all students in each school or district, in effect including an entity in the benchmark it’s being measured against. They should have paired entities for comparison purposes, of course: boys and girls, free-lunch kids and kids not getting free lunch.
JR: How does flawed evidence do harm when district leaders make big decisions?
SR: When district leaders sit down to build their plans for the next school year, they take the evidence handed to them by the California Department of Education and decide where they see problems of practice, areas where their vital signs appear to be lagging. Then they decide to spend money and allocate teachers’ precious time to improving things. If they are aiming those resources at “problems” that aren’t really problems at all, and missing more compelling challenges due to flawed evidence, then money and time are wasted, and opportunities to learn for the students who need them are missed.
I would like to see districts build their own bodies of evidence from which they gauge where they stand, relative to others whose kids and communities most like their own. If they viewed the evidence they are handed by the state with a dose of skepticism, it would be a good start. In fact, state law and policy in California has explicitly encouraged districts to embrace local control. If they exercised this local control when measuring their schools’ and their district’s vital signs, they’d be much more likely to make wiser decisions.