 Steve Ayon is a one-man wiz whose smart work visualizing CAASPP results and CDE accountability findings has proven to be quite popular. His CAASPP/SBAC visualizations have been used more than 4,000 times, and the accountability results have enjoyed more than 8,000 uses (stats courtesy of the Riverside CoE Tableau Public profile page). Thankfully, the Riverside County Office of Education has taken due note of his popularity, and has supported his work.
I learned of his work at last November’s CERA conference, where he and his colleague, JoAnne Lauer, demo’d both of these visualizations to a packed room. This crowd was leaning forward, taking notes, and snapping screen shots — evidence of a very engaged audience.
About Steve’s background
Steve’s talents were honed in the private sector. (Click here to see his Linked-In profile.) He worked for Toyota for 11 years. For the last three of those years, he was a decision support analyst. Then from 2007 to 2013 he worked as a business intelligence architect for Cal Poly Pomona. By the time he landed at Riverside CoE in 2013, he had developed skills and habits of mind that are all too rare in the K12 world. His current title: administrator of data and analytics. Note that Steve also built a business of his own, Usable Data, to extend opportunities to put his talents to work.
To the credit of his management at Riverside CoE, Steve enjoys the freedom to apply his talents to visualizing the data that has been so daunting to so many educators. His talents have also been recognized outside of Riverside County. Tony Thurmond, California State Superintendent of Schools, recruited Steve to join his transition team committee on data collection. Quite an honor.
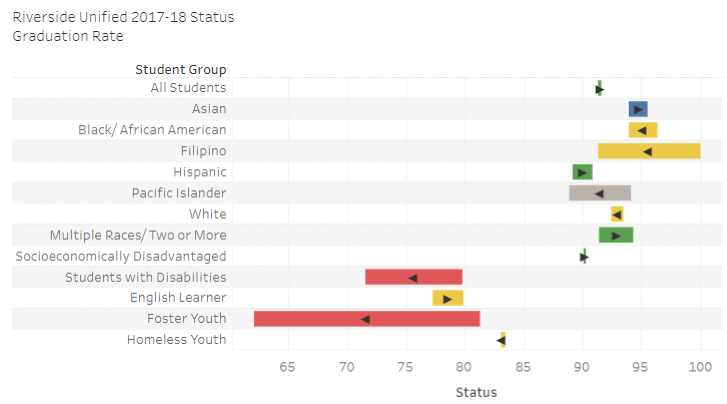
Graduation rates of student subgroups for high schools in Riverside USD.
He has cleverly uncoupled the “status” and “change” measures that the CDE unwisely bound together in their Dashboard. By giving them a distinct expression, he has made it possible for users to understand each separately. “Status” is expressed (see below) as a bar on a line. One end is current year. The other end is prior. This clarity, however, comes with a disadvantage. He has to rely on a carrot [> or <] to indicate whether the change has been positive or negative. [Click here to see the Dashboard viz.]
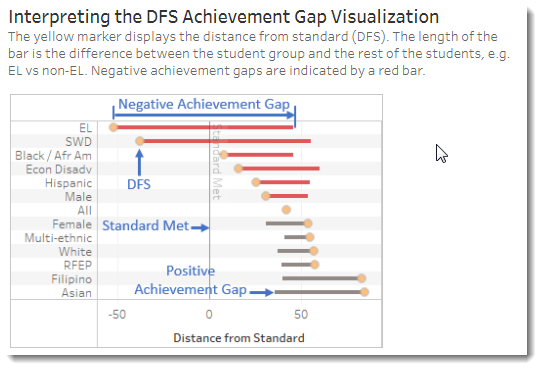
He has also improved on the CDE’s flawed method of calculating gaps. The CDE’s error is that they compare the subgroup to the whole of which it is a part. That is a logical no-no. Steve corrected for this error by comparing the subgroup to all others. So, for example, the grad rates of Hispanic/Latino students is compared to all those who are not Hispanic/Latino. While this method is different from the customary pairing of white students with any other ethnic subgroup, it is a reasonable alternative.
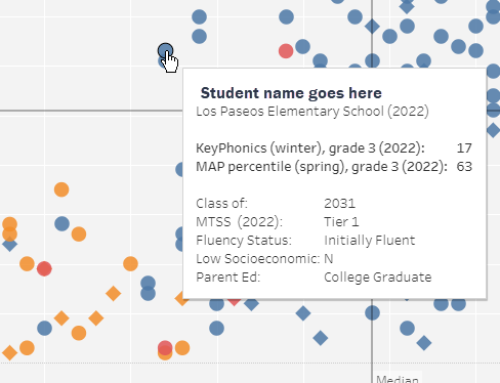
The benefit of seeing the test results for all subgroups of a district or a school on one screen is that we can see relative differences easily. Using a sensible metric (distance from standard) as a common denominator across all screens, and by ranking the primary display by the size of each subgroup’s gaps (defined as its variance from all other students’ scores), Steve has brought clear measures to an important conversation. Too often, that conversation about achievement or outcome gaps ignores the question of “how big is it?” And yes, size matters. [Click here to see the CAASPP viz.]
Full view of English Language Arts CAASPP/SBAC scores of students at Riverside USD, measured in distance from standard.
The question of how gaps are trending is also answerable here. Steve has incorporated all four years of CAASPP/SBAC results so you can easily see how things have changed. For consistency, he uses the distance-from-standard as the measurement scale.
He’s also created documentation to guide users. Part of that is a four-minute video to accompany the documentation. The music’s great, by the way. I suspect it’s his band’s handiwork, too. Originality for Steve is not just technical. It’s aesthetic, too.
Imprecision of assessment results aren’t visible
But when I asked Steve if he had a psychometrician working with him in the county office, he said “Unfortunately, no.” This leads to a problem. Test results are fuzzy creatures. They contain imprecision, what the psychometricians call “standard error.” This is inherent in all assessments. But it is especially important in the CAASPP/SBAC test. Since the computer-assisted assessment contains only 35 to 45 questions, it is a shallow sampling across the many standards. The test is also trying to find the right level of difficulty that best matches the student’s level. These factors, combined with dozens of student and environment specific factors, result in a margin of error at the student level of between (+)(-) 25 to 30 scale score points, and at the school level of between (+)(-) 10 to 15 points, and at the district level of between (+)(-) 4 to 10 points. That’s a big swing, and it is compounded when measuring prior year against current year.
So test results are imprecise, and that’s not all. They are imprecise to that degree about 68 percent of the time. That means that 2 out of 3 times, the error margin will remain within those bounds. But 1 out of 3 times, it will exceed it.
This has a potentially very big consequence in the interpretation of results at the student level, a pretty big consequence at the school level, and a moderate consequence at the district level.
This omission within Steve Ayon’s otherwise excellent visualization work is all too common in California. The CDE has also kept the error margins and confidence intervals far from plain sight. The CDE reports that are given to educators as well as the parent reports that are mailed home no longer contain expressions of these error margins. In the first two years, however, they were visible. (I’d love to know how they came to be removed.) So Steve and the Riverside CoE are just following the CDE’s lead in keeping imprecision out of sight.
However, the omission is a serious one. The American Psychological Association publishes a bible on assessment: Standards for Educational and Psychological Testing. The newest edition (2014) includes a chapter on standards for reliability/precision. Cluster 2 (on page 43) includes Standard 2.3, which reads:
“For each total score, subscore, or combination of scores that is to be interpreted, estimates of relevant indices of reliability/precision should be reported.”
Standard 2.4 addresses the comparison of two scores, relevant to both gap measures and to prior-to-current change scores:
“When a test score interpretation emphasizes differences between two observed scores of an individual or two averages of a group, reliability/precision data, including standard errors, should be provided for such differences.”
My hope for the next iteration of these excellent visualizations is that Steve is given a development budget by his boss at Riverside CoE that will fund a psychometrician in the team. Work of this quality deserves to rest on a firmer psychometric foundation.